
Your CEO Wants Profit Answers, Not Dashboard Metrics
MarTech highlights a familiar gap: dashboards report what happened in a campaign, while leadership wants to know how customer behavior drives growth, margin and profit. Here is how to close that gap.
Rajesh Kumar · 26 Oct 2026 · 3 min read
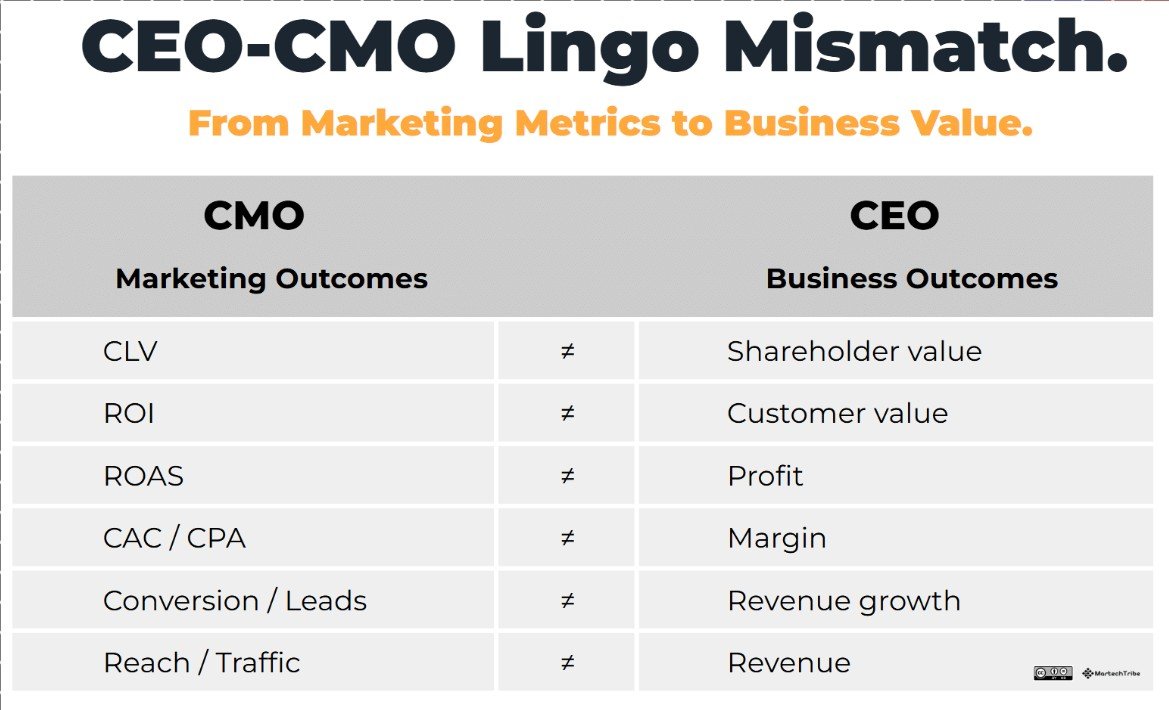
- Campaign dashboards explain what happened, but leadership wants to know how marketing affects growth, margin and profit.
- Activity metrics like clicks and impressions are useful for optimization but should not be the final business story.
- Add margin, repeat purchase and customer behavior data to reporting, especially in ecommerce.
- Align metric definitions with finance so marketing numbers are trusted.
- Use qualitative signals to cover AI search and social discovery that attribution misses.
What happened
MarTech published a piece with a simple point: marketing metrics show what happened in a campaign, but the harder job is connecting customer behavior to growth, margin and profit.
The source text is brief, so I will not pretend to report details beyond that framing. What I can do is explain why the point matters and what I would do about it, based on years of working with ecommerce and marketing teams.
Why it matters
Most dashboards are built around activity. Impressions, clicks, sessions, open rates, cost per click and platform-reported conversions are easy to collect and easy to chart. They answer the question, "Did the campaign do what we expected?"
A CEO or owner is asking something different: "Is marketing making the business healthier?" That question is about revenue quality, margin and profit, not about how many people saw an ad.
This gap is getting wider. Search results now include AI summaries. Shoppers research in ChatGPT, Gemini and Perplexity before they ever visit a site. Social platforms influence buying without producing a clean click. Last-click reports capture less of the real journey, so a dashboard can look tidy while missing the behavior that actually drives growth.
There is also a trust problem. If marketing reports success in metrics the finance team does not use, leadership will discount the numbers. Budgets then get decided on cost-cutting logic rather than growth logic.
Activity metrics versus business metrics
Neither is useless. Activity metrics are good for diagnosing problems and optimizing day-to-day work. They just cannot be the final story.
Here is how I think about the translation:
- Traffic is only useful if it connects to customers who buy, return or become valuable over time.
- Conversion rate matters, but it can hide discount-driven orders that hurt margin.
- Revenue is incomplete without product cost, shipping, returns and ad spend.
- Customer behavior such as repeat purchase, product mix and time between orders explains growth better than a single campaign report.
Practical actions
1. Start with the question leadership asks. Ask your CEO or finance lead which three business questions matter most this quarter. Build reporting around those, not around what your tools export by default.
2. Bring margin into marketing reports. If you run an online store, show performance by product category or contribution margin where you can, not just revenue. A campaign that sells low-margin items at heavy discounts may look great on a dashboard and weak in the accounts.
3. Track customer behavior beyond the first sale. Look at repeat purchases, which products lead to second orders and which channels bring customers who come back. Even a simple spreadsheet cohort view is better than none.
4. Agree on definitions with finance. Align on what counts as a customer, a conversion and revenue. Many reporting arguments are really definition arguments.
5. Add qualitative signals for AI and social discovery. Not everything is trackable. Ask customers how they found you at checkout, monitor branded search growth and check how your brand appears when people ask AI tools about your category. These are imperfect signals, but they help explain results that attribution misses.
6. Report decisions, not just data. For each report, state what you will stop, start or change. A dashboard that leads to no decision is decoration.
What smaller businesses should do
You do not need an expensive analytics stack. Pull monthly revenue, ad spend, gross margin and repeat customer rate into one page. Add a short note on what changed and why. That single page will often be more useful to an owner than twenty platform screenshots.
The goal is not perfect attribution. It is a credible, consistent link between marketing activity and business results, with honest notes on what you cannot measure.
The bottom line
Dashboards are good at describing campaigns. Growth conversations need something broader: how customers behave, what that does to margin, and whether the business ends up more profitable. Marketers who can bridge that gap will have better budgets and better influence.
Raj's takeI have sat in many meetings where the marketing report was green and the owner was still worried, and the owner was usually right to be. Build one page that links marketing to margin and repeat customers, and you will earn more trust than any dashboard full of charts.
Want this applied to your business?
Related

Alexa for Shopping Hits 400M Users: What Sellers Must Do Now
Amazon says over 400 million customers used Alexa for Shopping in the past 12 months, and those users spend 50% more. For brands, the AI shopping assistant is becoming a new storefront layer inside a walled garden.

AI Shopping Visibility: Fix Your Product Data First
A Search Engine Journal webinar recap shows AI shopping tools need product data that bots can retrieve, shoppers' language, and feeds that match pages. Here is what ecommerce teams can do now.

Three AI Models, Same 20 Products, Three Different Winners
A test of three Claude models shopping Shopify's catalog found they never agreed on a top pick. For merchants, which store wins an AI-driven order may depend on the model the shopper's agent runs on.